Reading time: 15 minutes | Lab time: 30 minutes
Your First eBPF Hook: Monitoring Syscalls with bpftrace in 30 Minutes
Series: eBPF Security & Observability — Week 1, Thursday
Type: Deep Technical Lab
Main tool: bpftrace
Target: Developers, Security Engineers, SRE
Reading time: ~15 minutes
Lab time: 30 minutes
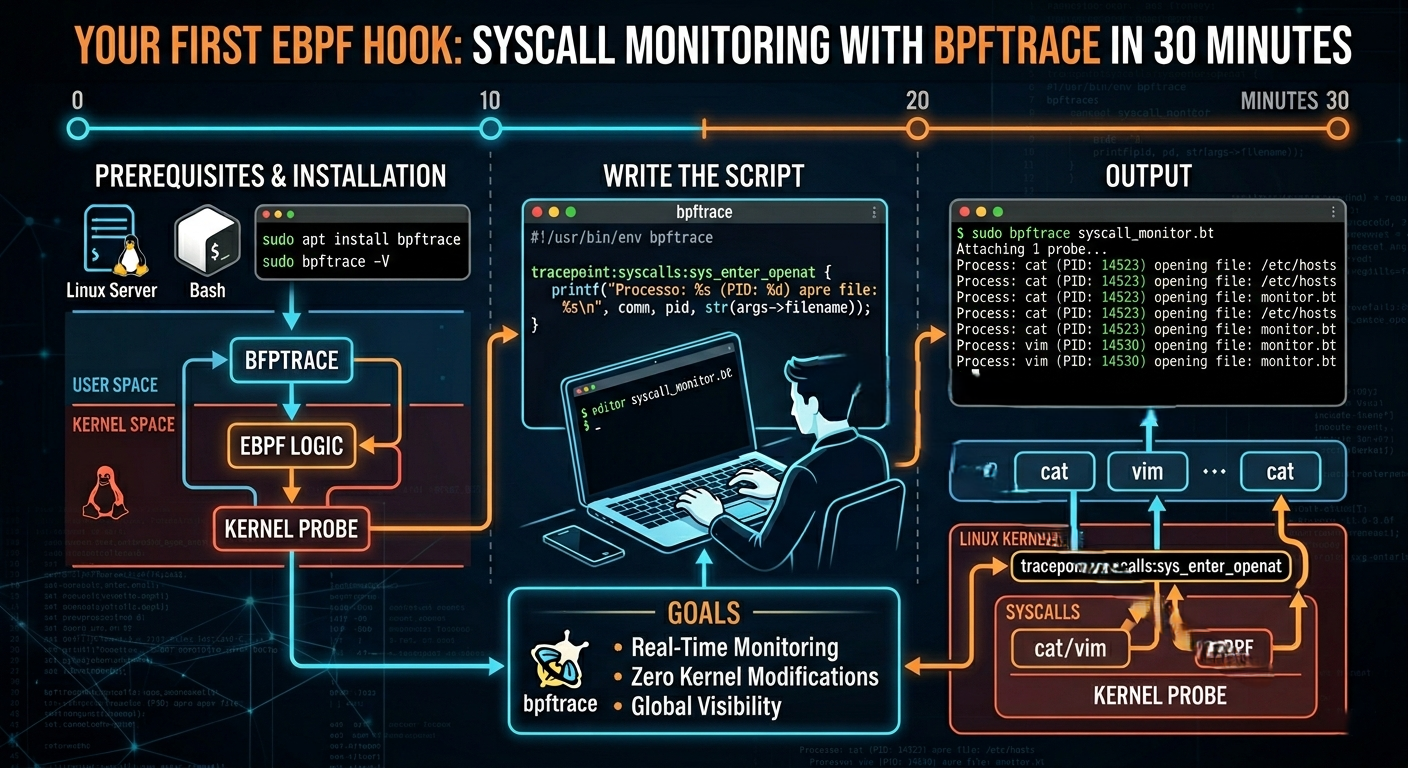
Have you ever wanted to know exactly what your operating system is doing at this precise moment — which processes are starting, which files are being opened, which network connections are being established — without installing heavy agents, without restarting anything, without modifying a single line of your application code?
This article shows you how to do it in 30 minutes using bpftrace, one of the most powerful and underrated tools in a security engineer’s or SRE’s arsenal. By the end you will have a working syscall monitoring system outputting JSON ready to be ingested by any SIEM.
What is bpftrace and why you should learn it now
bpftrace is a high-level scripting language for writing eBPF programs without having to deal with the complexity of C or the kernel linker. Think of it as awk for the Linux kernel: expressive, compact, immediately executable.
Its most important characteristic from a security standpoint is this: it operates directly in the kernel, at the syscall level, before any abstraction layer can modify or suppress events. Malware that tries to hide by manipulating system logs, files in /proc, or userspace hooks has no escape from a bpftrace probe attached to the right tracepoint.
In 2024, tools like Falco and Tetragon — which we will cover in the coming weeks — use eBPF under the hood for exactly this reason. Understanding bpftrace gives you the foundations to understand how those tools work at an architectural level, and lets you write custom detectors for use cases that no pre-packaged tool covers.
Prerequisites
| Requirement | Details |
|---|---|
| OS | Ubuntu 22.04 LTS (or any Linux with kernel ≥ 5.4) |
| Kernel | 5.15+ recommended |
| bpftrace | ≥ 0.18 |
| Privileges | root (sudo) |
| Prior eBPF knowledge | Not required |
Environment setup
The lab is tested on Ubuntu 22.04 LTS with kernel 5.15 or higher. bpftrace works on any kernel ≥ 4.9, though some tracepoints may have slightly different names on older kernels.
Installation
| |
Verify the installation succeeded:
| |
Expected output:
bpftrace v0.18.0
Verify that kernel tracepoints are available:
| |
Expected output (first 20 lines):
tracepoint:syscalls:sys_enter_accept
tracepoint:syscalls:sys_enter_accept4
tracepoint:syscalls:sys_enter_access
tracepoint:syscalls:sys_enter_acct
tracepoint:syscalls:sys_enter_add_key
...
If you see this list, you are ready. If you get a permission error, make sure you are running the commands with sudo.
Your first bpftrace program: tracing sys_execve
sys_execve is the syscall the kernel executes every time a process launches another one. It is the entry point of any command execution on the system — and one of the most monitored vectors in the MITRE ATT&CK framework (technique T1059: Command and Scripting Interpreter).
Start with the simplest possible version:
| |
Open a second terminal and type any command, for example ls -la. Switch back to the bpftrace terminal and you will see something like this:
PID: 12847 | COMM: bash | CMD: /usr/bin/ls
PID: 12848 | COMM: ls   | CMD: /bin/uname
What you are seeing is every process being executed on the system, in real time, with its PID, the parent process name (comm) and the path of the executed binary. This happens at the kernel level, before any userspace logging system can intervene.
Adding sys_openat: seeing which files are being opened
sys_openat is called every time a process opens a file. For threat detection this is critical: ransomware encrypting files, data exfiltration, access to credentials in /etc/passwd — everything passes through this syscall.
| |
The output will be very verbose — every file access on the system, including those made by the OS itself. Adding a filter for a specific process makes the result more readable:
| |
The /comm == "python3"/ block is a filter expression: the eBPF program will execute the body only when the condition is true. This filter happens at the kernel level — you are not filtering output in userspace, you are reducing the load before the event ever reaches your terminal.
Monitoring network connections: sys_connect
sys_connect is the syscall that establishes a TCP or UDP connection. Every process that opens a connection to the outside passes through here — including malware trying to reach Command and Control (C2) servers, mapped to MITRE ATT&CK technique T1071: Application Layer Protocol.
| |
To see destination IP addresses in a readable format, a slightly more advanced approach using kprobe instead of tracepoints is needed. We will cover that in a dedicated article on eBPF networking. For now, this hook gives you visibility into which processes are opening connections.
Putting it all together: a multi-probe script with JSON output
Now let us build something genuinely useful for production: a bpftrace script that monitors all three syscalls simultaneously and produces output in JSON Lines (JSONL) format, ready to be ingested by a SIEM like Elasticsearch, Splunk, or any system that accepts structured logs.
Create a file called syscall_monitor.bt:
| |
Run the script and redirect output to a log file:
| |
The 2>/dev/null flag suppresses bpftrace debug messages. The output is a JSONL file — one event per line — that you can process with jq:
| |
Sample output of the second command:
     47 "python3"
     23 "bash"
      8 "vim"
      3 "curl"
      1 "nc"
If you see nc (netcat) or curl in the list of processes writing to files, it is worth investigating further.
5 minutes of practical analysis
Before closing this lab, run the script for 5 minutes on your system — even on a development machine — and answer these questions:
1. How many distinct processes appear in the exec list?
If the number is higher than expected, there are daemons or scripts starting silently in the background.
2. Are there processes opening files in write mode in unexpected paths?
Paths like /tmp, /dev/shm, or subdirectories of /proc are indicators of anomalous behavior.
3. Which processes are opening network connections?
A process like python3 or bash appearing in the connect list deserves immediate attention.
GitHub Repository
The complete code is available in the project GitHub repository.
The week-01 branch contains:
syscall_monitor.bt— the bpftrace script with 4 hooksscripts/process_events.py— Python processor with anomaly detectionexamples/sample_output.jsonl— sample output for offline testingrun.sh— quick start with live, report and file modes
| |
What’s next in the series
| Week | Article |
|---|---|
| Week 2 — Technical | Syscall monitor with Rust Aya: type-safe eBPF program from scratch |
| Week 4 — Technical | Lab: deploying Tetragon in Kubernetes for runtime policy enforcement |
| Week 8 — Technical | Lab: real-time MITRE ATT&CK mapper with bpftrace and Python |
MITRE ATT&CK Coverage
| Hook | Syscall | Technique |
|---|---|---|
| exec | sys_execve | T1059 — Command and Scripting Interpreter |
| open_write | sys_openat | T1027 — Obfuscated Files or Information |
| connect | sys_connect | T1071 — Application Layer Protocol (C2) |
Try the lab now and tell me: how many unexpected processes did you find on your system in 5 minutes of tracing? If you found something interesting, tag someone on your team who should see this output — most developers have never seen what is really happening underneath their applications. 👇
Tags: #eBPF #bpftrace #Linux #ThreatDetection #DevSecOps #CloudNativeSecurity #Security #SRE